Antenna Shootout: Professional Audio (Part 4 -Conclusion)
In professional audio productions, deploying a wireless audio system brings flexibility and mobility to the users. The use of wireless audio can be derived from essential needs such as providing sound reinforcement for a theatre cast who is extremely mobile (having a wired connection would be inconveniencing and unsightly). However, if the wireless system is not deployed correctly, wireless reliability would be compromised, and the original motivations of utilising wireless audio would not be fulfilled. This article aims to conclude the topics discussed in the previous parts of this series and further elaborate on some common questions gathered from readers.
In an RF engineer's eyes, a professional wireless audio system would typically be segmented into these various components (e.g. amplifier, local oscillator, mixer, filters and antenna). Out of all the components, the antenna plays an influential role in directly affecting how Radio Frequency (RF) is transmitted and received and how these signals travel through the environment. An antenna directly impacts the wireless system's overall performance and using poorer or unsuitable antennas for the application can make the system unreliable and not perform as expected. Since the antenna element is a component a user would be able to change with ease, the team at Maven thought it might be insightful to have a dedicated series of experiments to explore how various professional audio antennas perform in real-world environments, beyond the datasheet.

RF System block diagram
The measured results from these experiments are based on the physical and electrical conditions of each antenna the team at Maven has access to during the experiments. We are fortunate to have access to the following brands,
AKG
Audio Technica
Mipro
Professional Wireless
RF Venue
Sennheiser
Shure
Wisycom
Understanding the Antenna’s Radiation Pattern
One of the two measurement processes in this series of experiments would be the Open-Air test. The Open-Air test evaluates the real-world radiation pattern of each antenna in an open space. As we observed from the previous 3 parts of the antenna shootout series, we often observe a measured radiation pattern that differs from the datasheet. Such deviation is expected as the radiation patterns provided in a datasheet are typically measured inside a controlled environment (RF anechoic chamber) with little reflection and noise. The radiation patterns shown in Maven’s antenna shootout experiment are more representative of the real-world performance where reflections and noise are expected in the environment. The measurements are taken in an open space with 12 meters (diameter) of clearance in both the x and y axis.


From the measurements, we can also observe that the principal axis (radiation beam with the antenna's highest signal strength) is not always located at 0°. For example, the Sennheiser A 2003-UHF directional antenna has a signal peak slightly off-axis at 325°. This differs from conventional wisdom, where a user might physically point the log-dipole antenna 0° towards an area of interest and expect to receive the highest wireless signal strength. Hence, to achieve the best result from your antenna, it is important to understand the antenna's real-world electrical characteristics (e.g. taking advantage of a null zone to improve noise rejection or aligning the principal beam towards an area of interest).

Measured radiation pattern of the Sennheiser A 2003-UHF log-dipole antenna
Why 3dB beamwidth?
Unlike omnidirectional antennas which radiates equally in all directions perpendicular to its axis, directional antennas radiate preferentially in a single direction. Directional antennas concentrate the RF energies and propagate in a “beam” on the principal axis. The angle of this “beam” or beamwidth will determine how directional an antenna is.
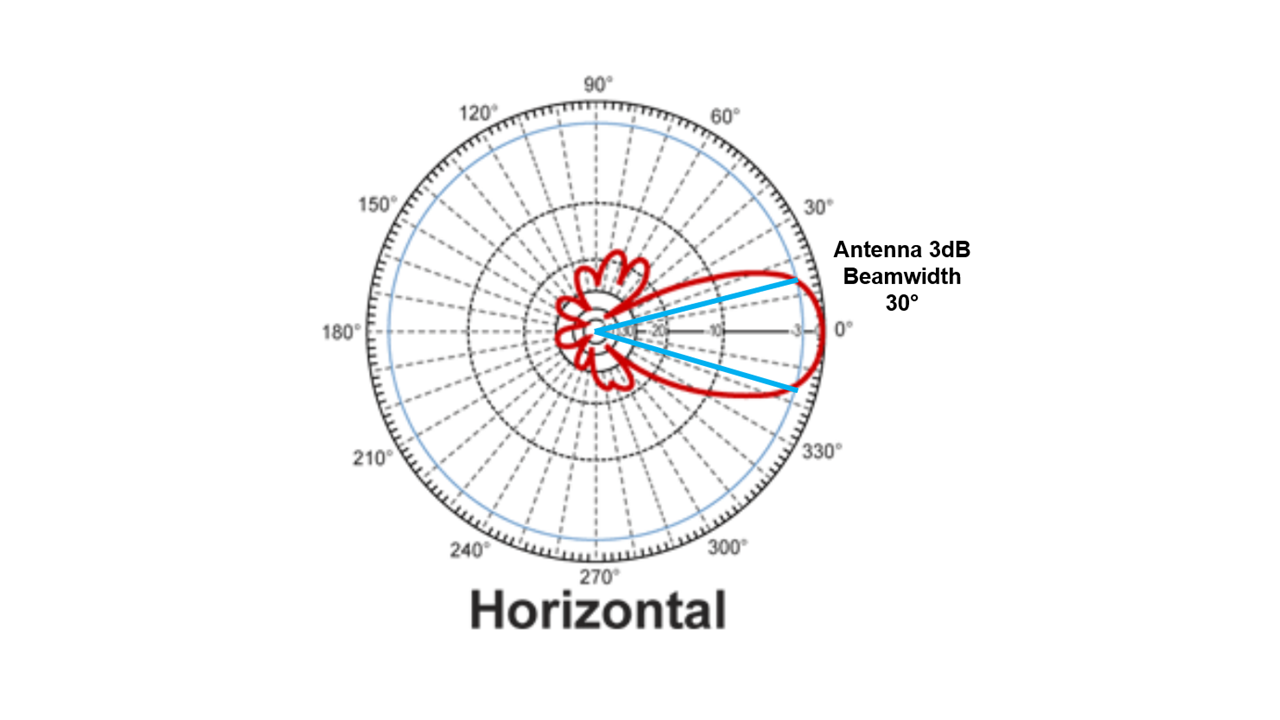
Antenna beamwidth
In both part 2 and 3 of this series, the team has used the antenna beamwidth threshold to be at 3dB. Why not 4dB, 5dB or even 6dB? Is there a significant meaning in adopting a beamwidth threshold at 3dB? Converting 3dB (log10) back to base10 (the number scale we are all comfortable with) will indicate that a drop in 3dB will reduce the antenna transmit/receive power by half.
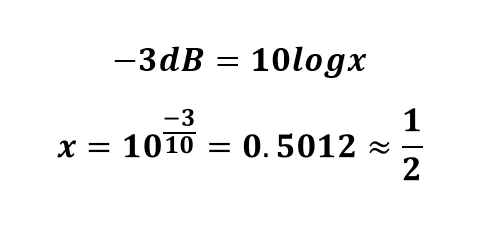
Converting 3dB from log10 to base10
The 3dB beamwidth helps illustrate the effective beamwidth of a directional antenna where the RF power within the beam angle will have a signal strength of greater than or equal to 0.5 and equal and the RF power outside the beam angle will have a signal strength of lesser than 0.5. The 3dB beamwidth is widely adopted in the field of antenna engineering and can also be commonly referred to as Half-Power Beamwidth.
On the other hand, in some consumer gears, a less stringent standard is also adopted to indicate the antenna’s beamwidth at 10dB (e.g. Bluetooth / WiFi antenna). A 10dB beamwidth will indicate that any RF power outside the beamwidth will only retain lesser than 0.1 of its original power.

Converting 10dB from log10 to base10

3dB and 10dB beamwidth threshold on Shure PA805SWB
Importance of coverage measurement
The coverage measurement evaluates the actual coverage of the antenna in an indoor environment. In an indoor measurement, more reflection is expected as compared to the open-air measurement, thus leading to a more pronounced multipath (fading) effect. As such, the antenna's actual performance inside an indoor environment can be very different from the datasheet. These deviations are especially pronounced where certain areas in the environment can experience destructive interference which lowers the RF power received.

Indoor coverage measurement (18m long by 30m wide)
The coverage measurements in this experiment shared insights on the effectiveness of the deployment for each antenna. Areas within the green zones enjoy high wireless reliability where the signal to noise ratio (SNR) is high and is unlikely to be impeded by environmental noise. Yellow and Orange zones exhibit average performance where the SNR is still adequate, but wireless reliability can be compromised when there is interfering environmental noise. Red zones are areas where the RF signals are low, and the SNR is insufficient to provide reliable wireless communication.

Indoor coverage measurement of RF venue Diversity Fin - Dipole Element (Horizontal Polarization)

Colour Legend of measured Wireless Coverage Map
Coverage Range
It is anticipated that the various antennas should achieve a high degree of good coverage (green/dark green zones) as the RF systems used during measurement are specified to operate within a range of 100 meters line of sight (LOS). The indoor space (auditorium) is approximate 18 meters long by 30 meters wide, and the furthest measurement point was approximately 19.5 meters LOS from the antenna under test (AUT). Thus, the furthest measurement point is of the specified range provided by the manufacturers and should achieve good transmission efficiency.

Indoor coverage measurement points
It is interesting to see some areas of coverage with fair signal strength (yellow zone) and below during the measurements. This shows that indoor multipath effects can have a significant detrimental impact on the performance on the antenna coverage in an indoor environment. Often, in an indoor environment, shifting the antenna position will also alter its coverage pattern. Hence, finding the optimal installation location for an antenna in an indoor environment becomes especially important to achieve the best-intended result from the antenna deployment.
What about Antenna Diversity?
So far, the coverage measurements shown in the previous parts of this series considers a RF system with a “single” RF input. Each coverage measurement illustrates the real-world coverage of a single antenna element in a specific location (in this case, the AUT location). An RF system's performance can improve drastically when an additional antenna is deployed to provide an alternative coverage zone. This practice is also known as RF Diversity, where the second antenna coverage pattern can act as complementary reinforcement for the weak coverage area from the first antenna.

Deploying a 2nd antenna for RF Diversity
To achieve diversity, the RF system must have 2 dedicated RF inputs where a selector circuit will receive the RF signals from both antennas and determine which input has the best SNR to be utilised. The team has used two Shure UA874 antennas to illustrate the real-world effects of RF diversity. Individually, both antenna A and B have their weak spots due to indoor multipath effect.

Coverage Pattern of Antenna A

Coverage Pattern of Antenna B
However, if both antennas' locations are well planned and deployed, each antenna's coverage zones can complement each other and improve the overall coverage measurement result drastically. In this particular case, antenna A performed well in providing coverage for the far end (top) of the auditorium while having some weak spots near the auditorium's bottom right. Antenna B can be deployed to compliment the weaker zones where it has better performance in providing coverage near end (bottom) than Antenna A. This setup shows the effectiveness of RF Diversity when design and deployed correctly in real-world.

Combined coverage from both antenna (RF diversity)
Should you combine antenna inputs?
Another common approach to “expand” your wireless coverage zone would be to utilise a passive RF splitter such as the Shure UA221. System integrators quite commonly adopt this method as the deployment can be very cost-effective and convenient to combine 2 antennas into a single RF input. In this approach, the RF system has no option to analyse and determine which antenna input has the best SNR as the RF power received from both antennas are passively summed.
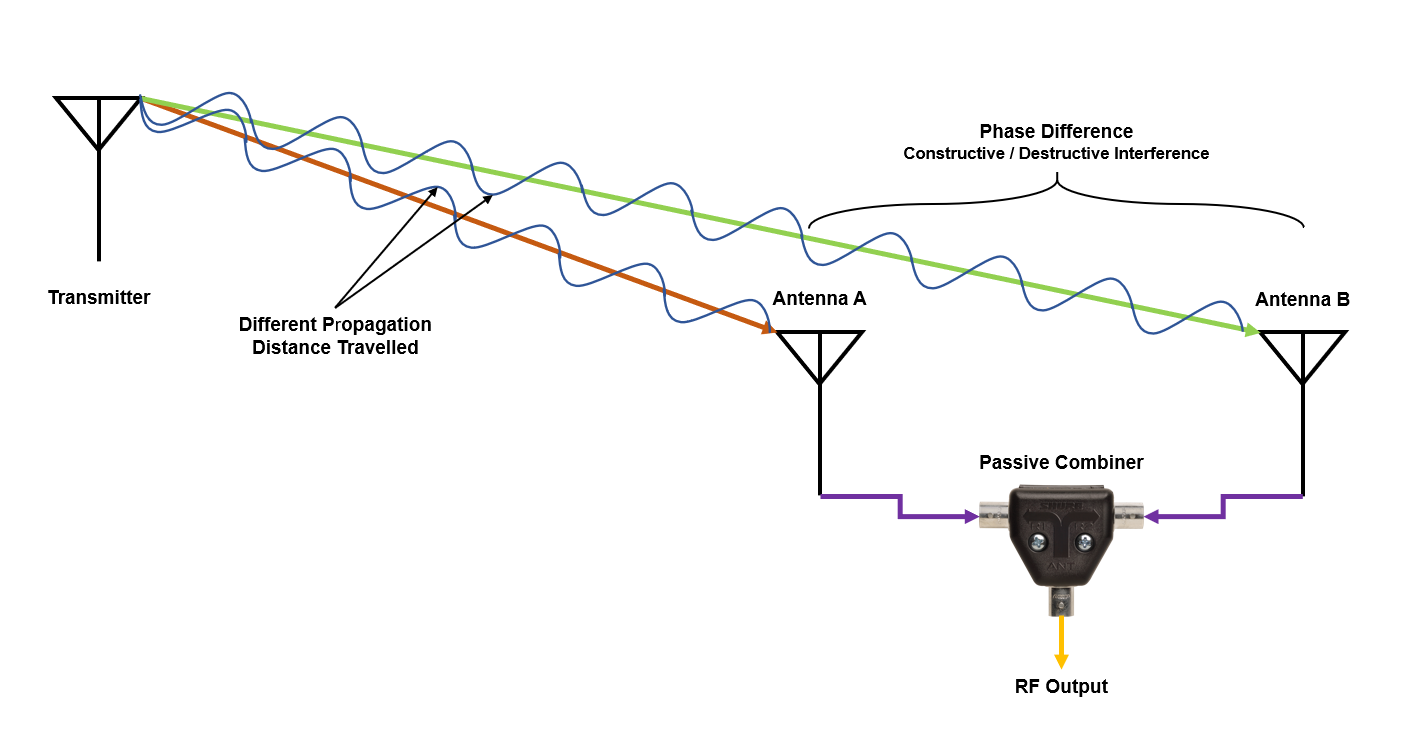
Passively combined antennas - Multipath propagation

Combined antenna setup - 2 x Shure UA8 and 1 x UA221
The team would like to caution against this practice as it can have detrimental effects when not deployed correctly. To elaborate, the team has set up two identical omnidirectional antennas that are passively summed into a single RF input. The antennas are then equally spaced from the splitter with equal cable length used. The coverage measurement below shows that instead of an expanded coverage zone, the passively combined antennas have zones that experienced complete destructive interference (similar to a comb filter in professional audio). This phenomenon is caused when the main antenna is too close to its counterpart and the difference in the received signals (phase) from both antennas are destructive pairs.

Measured multipath interference of two passively summed antennas
To minimise this effect in a system of passively combined antennas, the user should ensure that the antennas are adequately spaced apart. Ideally, each antenna counterpart's received power should be minimally 10 times lower than the main antenna to ensure that the destructive components are minimal.
Conclusion
The team has explored various antenna concepts and how they actually affect performance in the real world. To a RF system, wireless antennas are like the mouth (transmit) or ears (receive) of the system. For instance, our ears would perceive sound to be different in a cave than an open space (in this case, the sound would be perceived to have more echo in a cave than open space). Similarly, Maven’s experiments have illustrated real-world differences in antenna radiation and changes in coverage patterns in both indoor and outdoor environment.
Maven’s wireless measurements have helped demonstrate the effectiveness and need to visualise wireless signals with respect to a space. It is a good practice for users to understand a RF system's performance, identify potential weak spots, and find ideal antenna install locations to optimise wireless coverage range. Having a good understanding of how an antenna behaves in different spaces would be vital in building a reliable wireless system.
Thank you for staying with us throughout this series of antenna shootouts. We want to express our appreciation to our industry and academic friends who have helped make this experiment possible.